On November 12, 2026, a Microsoft 365 outage left many customers without Outlook and parts of Teams for nearly a day. Microsoft restored service in stages. It then said the incident "was introduced by an issue during an earlier network capacity upgrade that surfaced following a recent network change," and promised a full report after its review. Service came back well before the explanation did.
AI production debugging is the use of AI to find, explain and fix the causes of failures in live software. Some tools summarize an alert. Others are agents that query logs, metrics and code to test theories about a cause. This article covers incidents in production software, not the debugging of AI agents that run in production.
It pays off when a team ships often and has more alerts than people to read them. It also needs rich telemetry, the metrics, logs and traces a system emits. It helps less during an active outage, when rolling back the last change usually beats any investigation. It cannot help where the system recorded no evidence at all.
What Is AI Production Debugging?
AI production debugging means using models to help responders work out why a live system misbehaves and what to change. Unlike debugging in an editor, the evidence is rarely a failing test on a laptop. It is spread across alerts, logs, traces, deploy history, code, and the data the system writes.
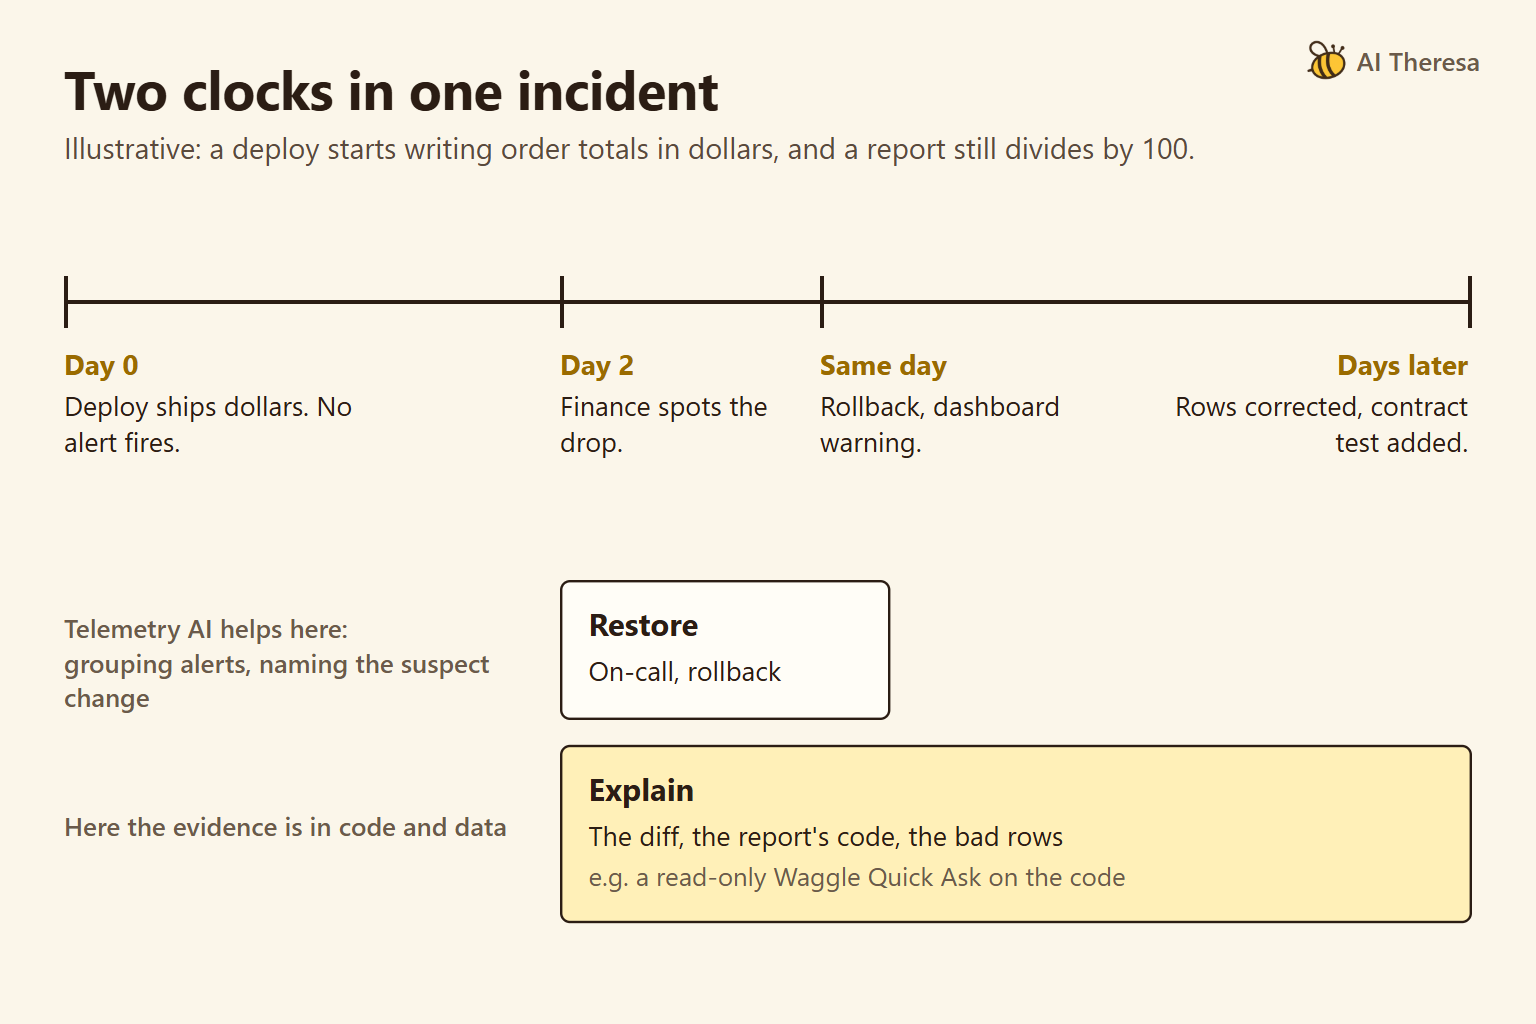
The work splits into two jobs that vendors often sell as one. Restoring service gets users back to a working system, often by rolling back a change. Explaining the cause finds which code or data went wrong, how far the damage spread, and how to stop it from happening again.
Restoring service takes minutes to hours and belongs to the on-call engineer. Explaining the cause can take days and usually needs the team that owns the code and the data. For infrastructure faults, telemetry often explains the cause too. For logic and data faults, the explanation usually sits in code and tables.
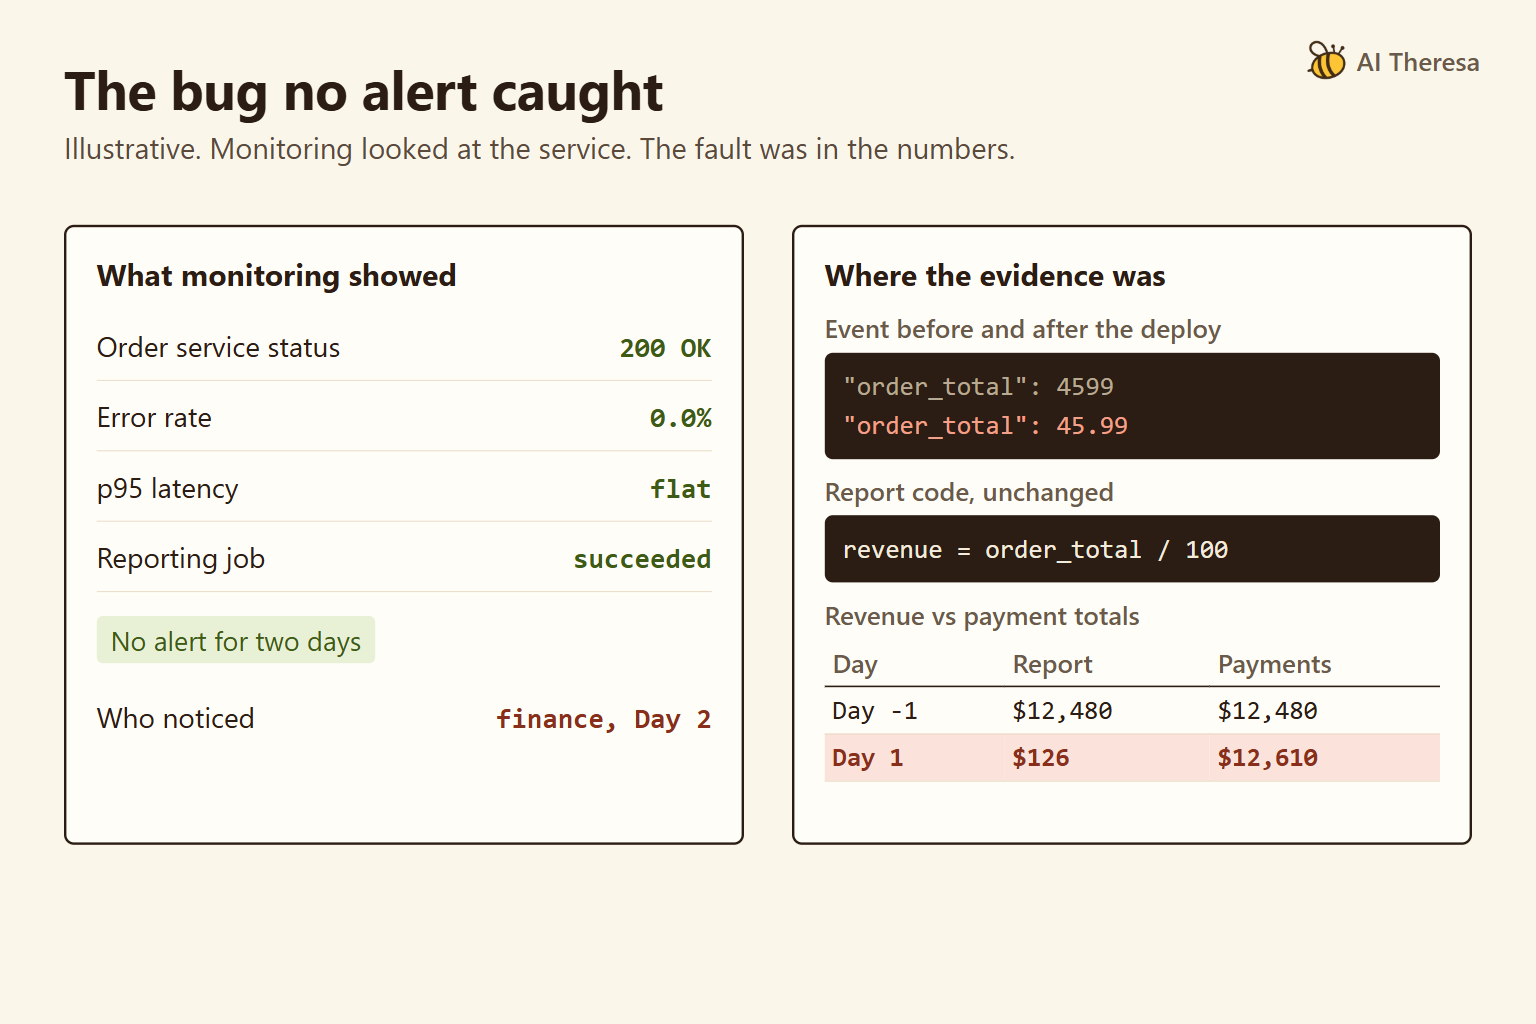
We use one illustrative scenario throughout this guide. A deploy changes the order-total field in the order service's JSON events from integer cents to decimal dollars. A downstream reporting job still assumes cents and divides by 100. Nothing errors, latency stays flat, and no alert fires.
Two days later, an analyst in finance notices that daily revenue since the deploy is 100 times too low.
Get Started with Theresa for FREEWhy Is Production Debugging Important?
Most production failures follow a change. Google's SRE book reports that roughly 70% of outages are due to changes in a live system. A team that ships every day therefore debugs in production often, whatever its test coverage.
Production also exposes bugs that tests rarely reach. Researchers from the University of Chicago and Microsoft studied the 112 high-severity Azure incidents caused by software bugs over six months in 2018. In 21% of them, different components or versions held inconsistent assumptions about a data format. Each component can pass its own tests while the two disagree.
The same study also describes silent corruption, a different fault class, where stored data became wrong without any error code. These failures cost more than downtime. A wrong revenue figure can feed a forecast, a price change, or a board report before anyone questions it.
Get Started with Theresa for FREEHow Does AI Production Debugging Work?
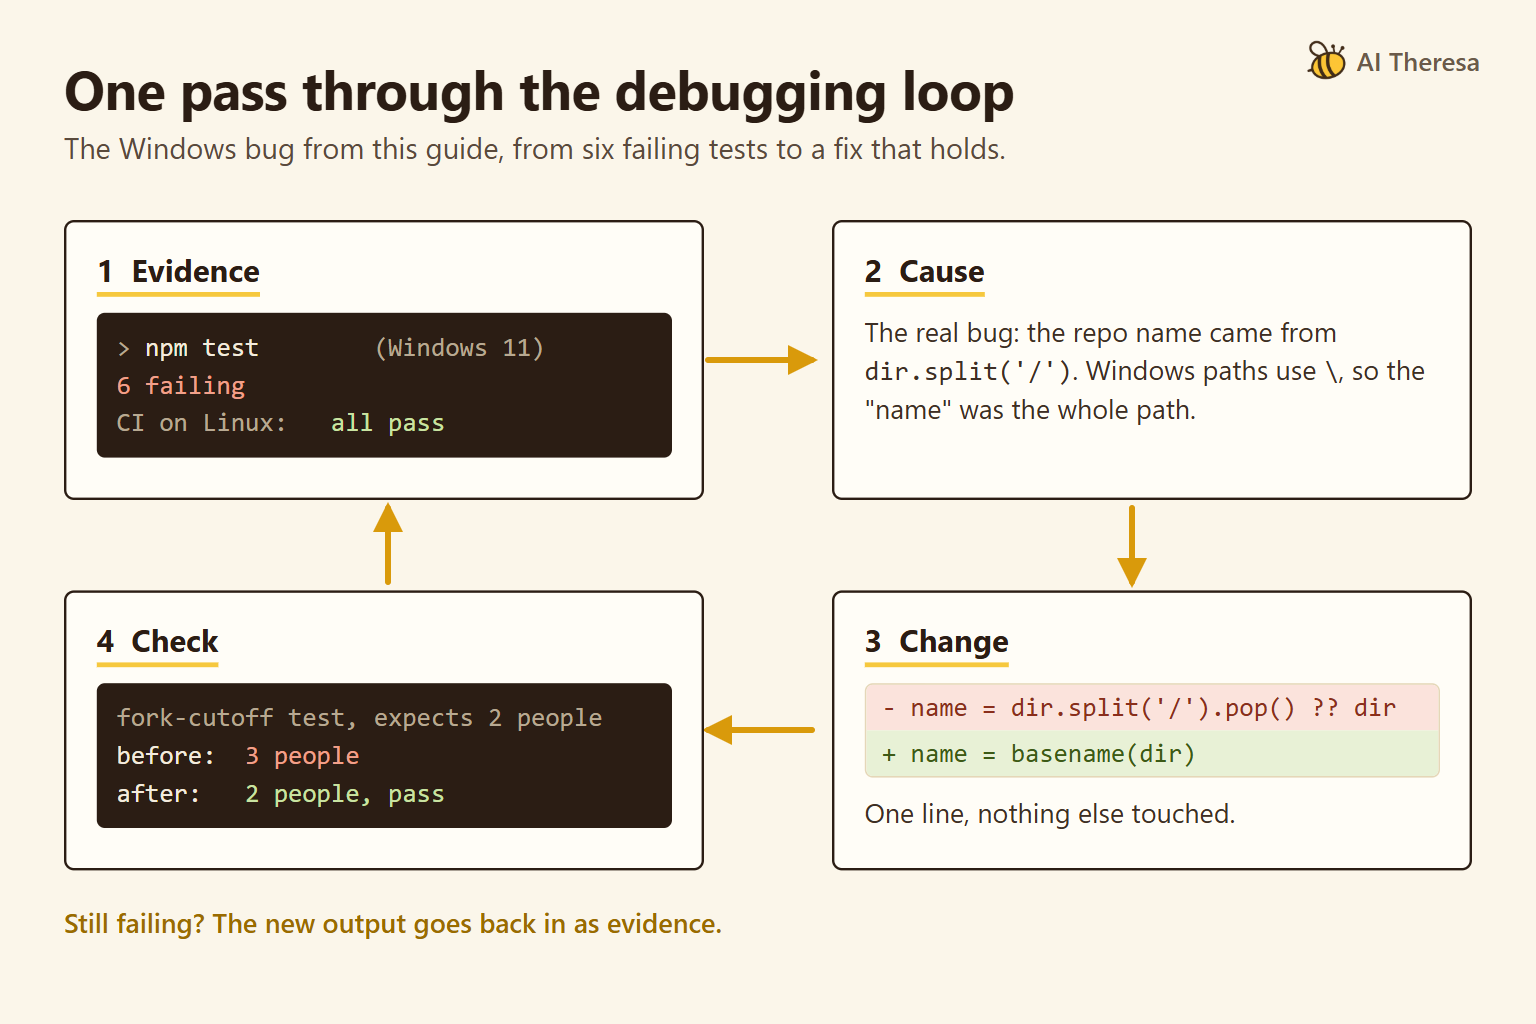
Good AI tools automate a method careful engineers already use. Google's troubleshooting chapter describes the work as an application of the hypothetico-deductive method: observe the system, propose a cause, then test it. An AI agent does the same with tool calls. It gathers context, lists competing hypotheses, runs a targeted query for each, and returns a verdict or says the evidence is inconclusive.
Datadog's engineers show why targeting matters. An early version of Bits Investigation made 12 tool calls on a Kafka lag incident, where a message queue fell behind.
One call found the real cause, a spike in commit latency. The summary still named the wrong one, distracted by alarming upstream errors. The newer version tests each hypothesis against the data that bears on it.
Ask for three things in every AI verdict: the evidence behind it, the alternatives it ruled out, and a query you can run yourself. An inconclusive verdict is still useful if it says which evidence is missing.
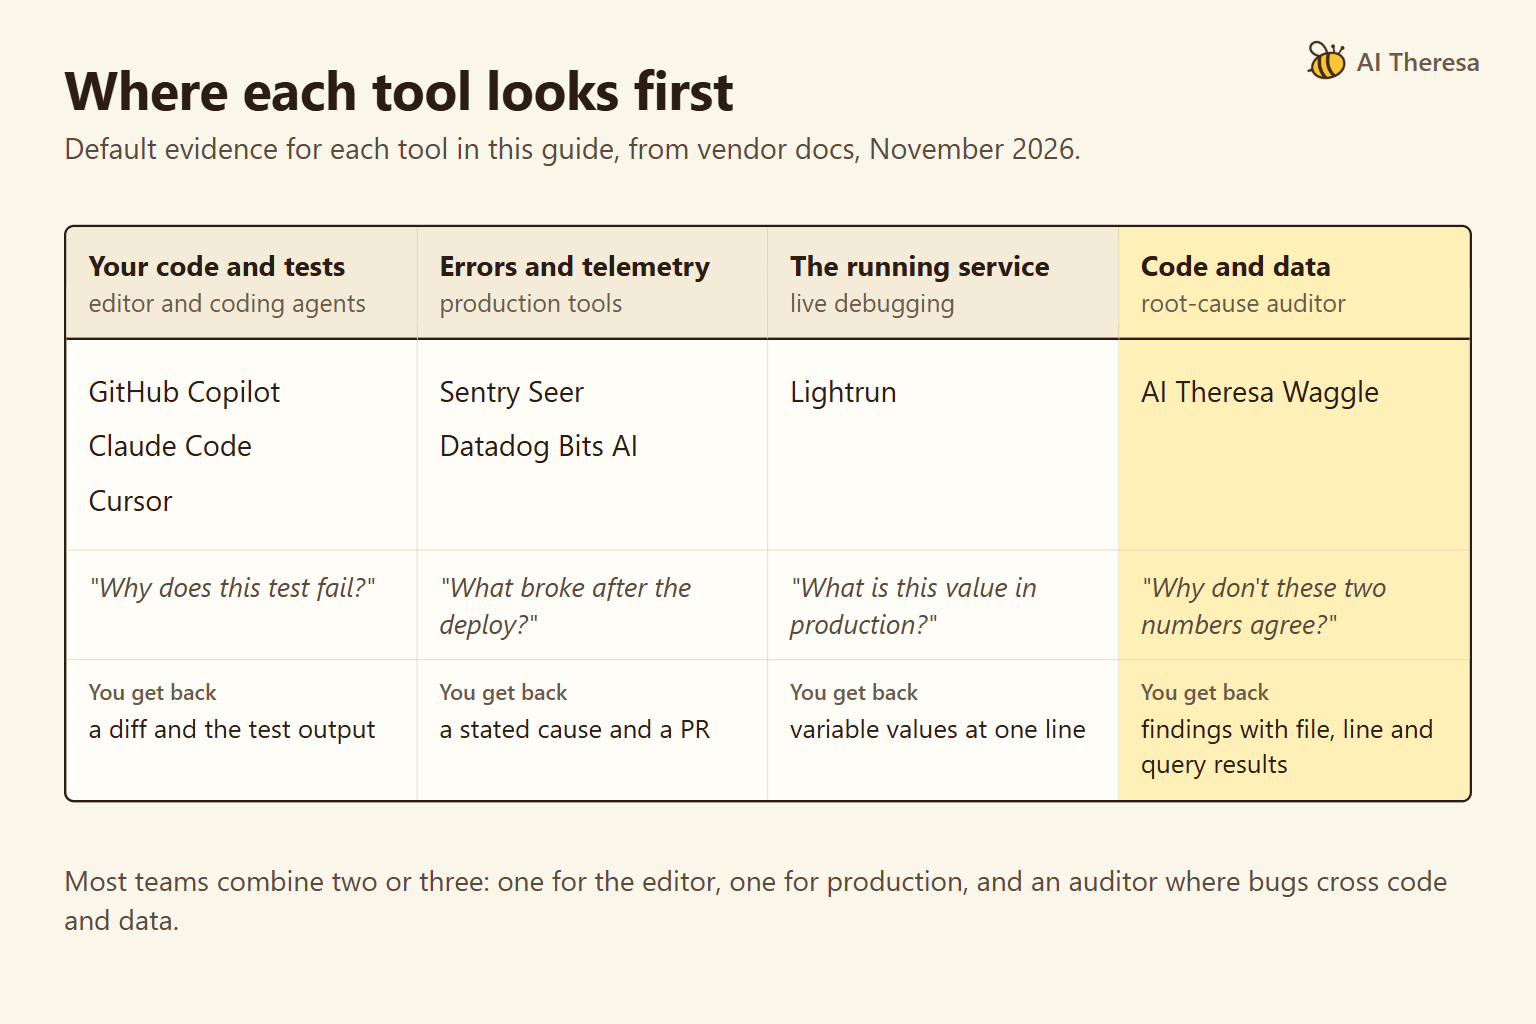
The table, drawn from vendor documentation rather than accuracy tests, shows which evidence each kind of tool reaches.
| Approach | Example | Evidence it reads | Blind spot to check |
|---|---|---|---|
| Assistant inside one tool | Sentry Seer | Errors, traces, logs (beta), code in linked repositories, some external tools | Business data and tables |
| Matching past incidents | PagerDuty Probable Origin | Incident patterns from the prior six months | Failures with no precedent |
| Agent across tools | Datadog Bits Investigation, incident.io Investigations | Telemetry, deploys, code changes, past incidents | Causes that leave no telemetry |
| Cloud provider agent | AWS DevOps Agent, Azure SRE Agent | Telemetry, code and deployment data | Sources its integrations do not reach |
| Causal topology | Dynatrace Intelligence | A dependency map of services and hosts | Faults that raise no anomaly |
In the cents example, none of these starts on its own, because nothing alerted. The evidence sits in a code diff, an event payload, and the rows themselves.
Waggle, AI Theresa's open-source root-cause auditor, works on that evidence, read-only. It reads code, runs SELECT-only queries on BigQuery, and reaches other sources through MCP, a standard way to link AI tools to data, using servers you set up as read-only.
In the cents example, a team could start with a Quick Ask on the order and reporting code: "Which readers of order_total assume cents, and what did the deploy change?" Through the Claude Code plugin, the answer comes with file and line evidence. To size the damage, a Full Scan with BigQuery connected tests claims about the affected rows with queries. A claim that does not hold up becomes an open question, and a hypothesis the evidence contradicts is reported as ruled out.
How Does AI Detect Production Issues?
Most AI detection works on telemetry. Baselining learns the normal range of a metric, such as error rate by hour of day, and flags departures from it. Alert correlation groups related alerts into one problem, so a responder sees one incident instead of forty pages. Log clustering reduces millions of log lines to a few templates, so a new error pattern stands out.
Change correlation lines up an incident with recent deploys, configuration pushes, and feature-flag changes. Since most outages follow a change, this is often the fastest route to a rollback.
All four methods need a signal that moves. In the cents example, request rates, latency, and error counts stay flat. The order service returns 200 OK, the status code for success, with a well-formed number in the wrong unit. Data-quality monitors, which watch table freshness, row counts and value ranges, could catch the drop, but few teams point them at business metrics.
That leaves a person in finance as the only detector. The Azure study shows this class of bug is common. In one public e-commerce case study, Theresa's team "traced untrustworthy dashboards to upstream schema drift and rebuilt them on a storage layer that holds." Schema drift means the shape or meaning of data changing upstream without the readers being updated.
Monitor the data against an independent truth. A daily reconciliation of reported revenue against the payment processor's settlement totals would have caught the cents bug on day one. So would an alert on a large day-over-day drop.
What Are the Causes of Production Bugs?
A useful habit is to separate the trigger from the root cause. Google's postmortem analysis records both for each outage.
Binary pushes and configuration pushes were its most common triggers from 2010 to 2017, while its top root-cause category was software. Microsoft's November outage had the same shape. A recent network change was the trigger, but the issue itself dated from an earlier upgrade. Rolling back a trigger restores service and leaves the root cause in place.
| Cause | How it shows up | Where the evidence lives |
|---|---|---|
| Code change | New errors or wrong behavior right after a deploy | Deploy history, the diff, the error tracker |
| Configuration or flag change | A sudden shift with no code deploy | Config history, the flag audit log |
| Data-format or contract mismatch | Wrong values, often with no error at all | Producer and consumer code, schemas, the data |
| Faulty error handling | A small fault grows into an outage | Exception handlers, logs at the time of the fault |
| Load or user-behavior shift | Slowness or timeouts under new traffic | Metrics, traces, capacity data |
| Dependency or provider | Failures that match a third party's outage | Provider status pages, network metrics |
In the cents example, the trigger is a binary push, a deploy of new code and Google's most common trigger. The root cause is a contract mismatch: two services never agreed on a unit for the field. Most incidents have several contributing factors. Here they include a field name with no unit, no contract test, and no check on the data.
The distinction changes the fix. Rolling back the order service stops new dollar values, but events written before the rollback stay in dollars. The deploy and rollback times bound the rows to correct.
Get Started with Theresa for FREEBenefits of AI-Powered Production Debugging
The main benefit is speed to a first hypothesis that comes with the queries behind it. Google's SRE book reports that recorded playbooks make repair roughly three times faster than "winging it." Repair there means restoring service, not finding the cause, and an agent that runs playbook steps helps that same stage.
Vendors publish large reductions in time to resolution, usually without a method a reader can check. The table lists benefits that show up in practice, and what to check before trusting each one.
| Benefit | When it shows up | What to check |
|---|---|---|
| Faster first hypothesis | Alerted incidents with rich telemetry | It cites a query you can run again |
| Runbook steps that run themselves | Repeated incident types | Steps are read-only, or a person approves each change |
| Postmortem drafts | After every significant incident | The draft names contributing factors as well as the trigger |
| Memory of past incidents | Recurring failures | A match to an old incident is a lead, not a verdict |
A postmortem is the written review after an incident. AI drafts save time, but a draft that stops at "a deploy caused it" repeats the trigger. In the cents example, the useful postmortem names the missing unit contract and the missing data check.
Get Started with Theresa for FREEChallenges of Production Debugging
Independent accuracy is improving but still low. ORCA-bench is a 2026 benchmark co-authored by Cornell Tech, Columbia and the AI SRE vendor Traversal. It gives agents 1,079 tasks on a demo microservice system, with six days of telemetry and full source code. On its realistic medium-difficulty tasks, the best of five frontier agents reached 25.3% accuracy.
The same paper supports the case for code. Removing source-code access lowered accuracy and raised the rate of invented root causes for every model tested. A tool that cannot read code or query business data will not explain the cents bug, however good its model.
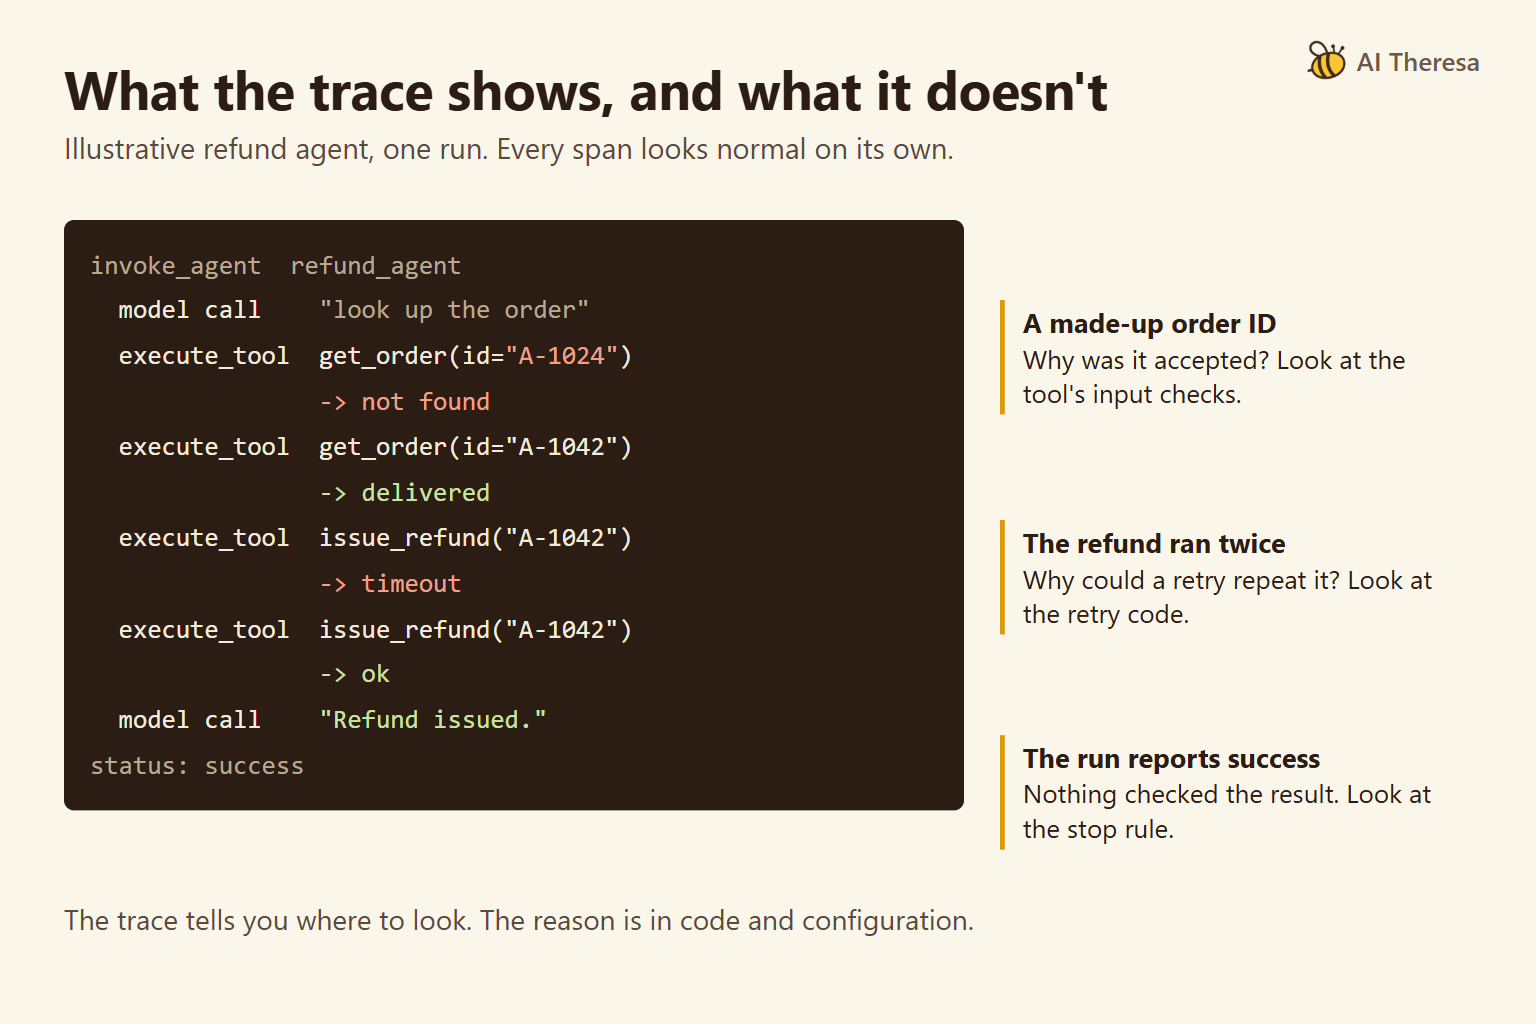
Most AI incident tools start from telemetry. Fewer read code, and very few query business data. New Relic says Autopilot "is not currently intended or designed to perform source code review or source code analysis." Datadog's Kafka example shows the other risk: a fluent summary that names the wrong cause.
Access needs the same scrutiny. Sentry's documentation notes that Seer Agent makes organization-wide queries and does not yet have finer-grained access controls. Check what each tool can read, and where that data goes, before you connect it.
Waggle has limits too. It does not detect incidents, ingest alerts, logs or traces, or run code. It works next to Sentry, Datadog or PagerDuty and does not replace them.
It publishes no accuracy benchmark. In a Full Scan, a separate claim audit re-checks each claim, but a model checking a model is a filter, not a test.
Get Started with Theresa for FREEHow Can AI Reduce Mean Time to Resolution (MTTR)?
Here MTTR means mean time to resolution, from the start of an incident until its cause is fixed and verified. Some teams use the same letters for repair, recovery or response, so check which one a vendor means. The average hides four stages that AI affects differently.
Detect is the time until someone knows. Acknowledge is the time until a responder owns it. Mitigate is the time until users stop being hurt. Resolve is the time until the cause is fixed and verified.
Baselines shorten detection, and alert grouping shortens acknowledgement. Pointing at the bad change shortens mitigation, because a rollback decision needs a suspect. Root-cause analysis on code and data shortens resolution, and its follow-up actions lower the chance that the bug returns.
In the cents example, detection took two days and came from a person, not from any AI tool in this article. Mitigation meant rolling back the order service, or pinning the field's unit back to cents, and putting a warning on the dashboard. Resolution meant correcting the rows written between deploy and rollback, finding every other reader, and adding a contract test that checks the field's unit.
Verification there is a query, not a log search. Reported daily revenue should match the payment processor's totals for every day, before, during and after the bad window. Waggle's incremental re-scans call a finding fixed only when its code changed. That checks the code side; the reconciliation query checks the data.
MTTR itself is a weak metric, because a few long outages skew it. DORA replaced MTTR in 2023 with failed deployment recovery time, which counts only failures caused by a change.
Measure the stages instead, as distributions per severity over a long window, since a quarter's incidents rarely show a trend. Track the time from page to the first evidence-backed hypothesis and the share of incidents with a confirmed root cause. Add the repeat-incident rate and the share of AI verdicts later overturned.
Theresa's Enterprise plan helps with the explaining half. It adds a dedicated team of a product lead and two engineers, runs in your own cloud, and starts with a 14-day free trial.
Get Started with Theresa for FREEConclusion
AI production debugging works best as two jobs with different evidence. Telemetry AI helps restore service and often explains infrastructure faults. Code and data analysis explains the failures that telemetry cannot see.
Mitigate first, with people and rollbacks. Use AI to generate and test hypotheses, accept only verdicts with evidence you can run again, and measure each stage rather than one average.